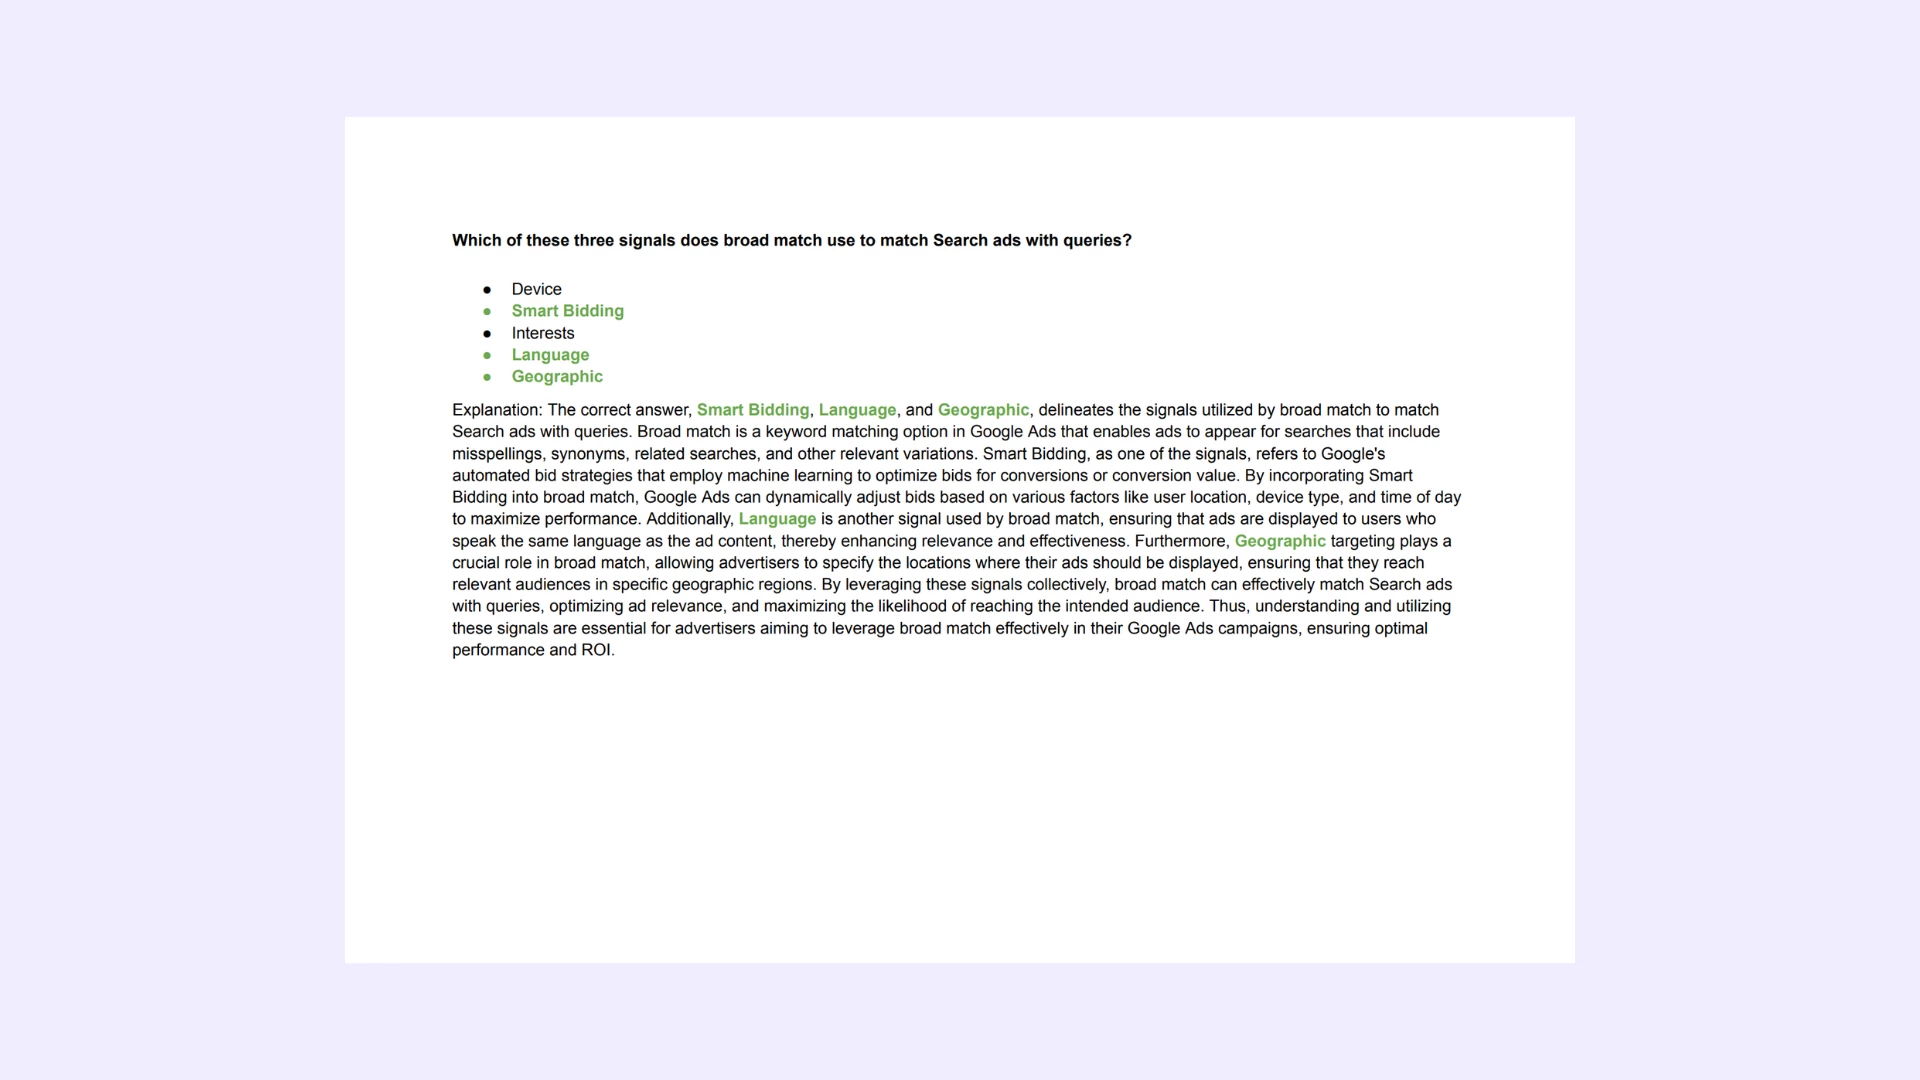
If you wanted to view multiple groups of data side by side in a table report, which component of the Google Analytics interface would you select?
Select Filters.
Select Comparisons.
Select Segments.
Select Date Picker.
Google SkillShop Bundle. Includes answers for every real Google SkillShop certification exam.
All-in-One: Get all Google SkillShop exams answers with explanations in one bundle. This package includes answers for every current Google SkillShop Platform certification. Regular updates Free updates. -> See what's included.
Questions | Answers | Explanations. Free Lifetime Updates.
Need a single cerification exam answers? Check out our -> list of certification exams answer keys. Learn Smarter. Obtain or Renew your certificates with peace of mind!
Explanation: If you wanted to view multiple groups of data side by side in a table report, which component of the Google Analytics interface would you select?
Explanation: The correct answer is **Select Comparisons.** In Google Analytics, the Comparisons component allows users to view multiple groups of data side by side within a table report, facilitating direct analysis of different metrics or dimensions. By utilizing this feature, you can easily identify trends, differences, and similarities between various data sets, enabling a more comprehensive understanding of user behavior and performance metrics. This side-by-side comparison enhances the analytical process and aids in making informed decisions based on the insights gathered.
Google SkillShop Roll. Special Offer
Note: We conduct daily checks for updates on the exam, ensuring that the file contains the most recent questions from the actual certification program.
Questions | Answers | Explanations. FREE Updates.
Were do I find this certification program?
This certification program is available on the Google SkillShop Platform. With our file, you can get certified in just a few minutes. Free updates are included.
Save time on exams and spend more time practicing.
Best-value Guides
- Special Bundle Offer Google_Ads_Roll
- Special Bundle Offer HubSpot_Exams_Roll
- Special Bundle Offer Google_SkillShop_Roll
- Special Bundle Offer Marketing_Platforms_Roll