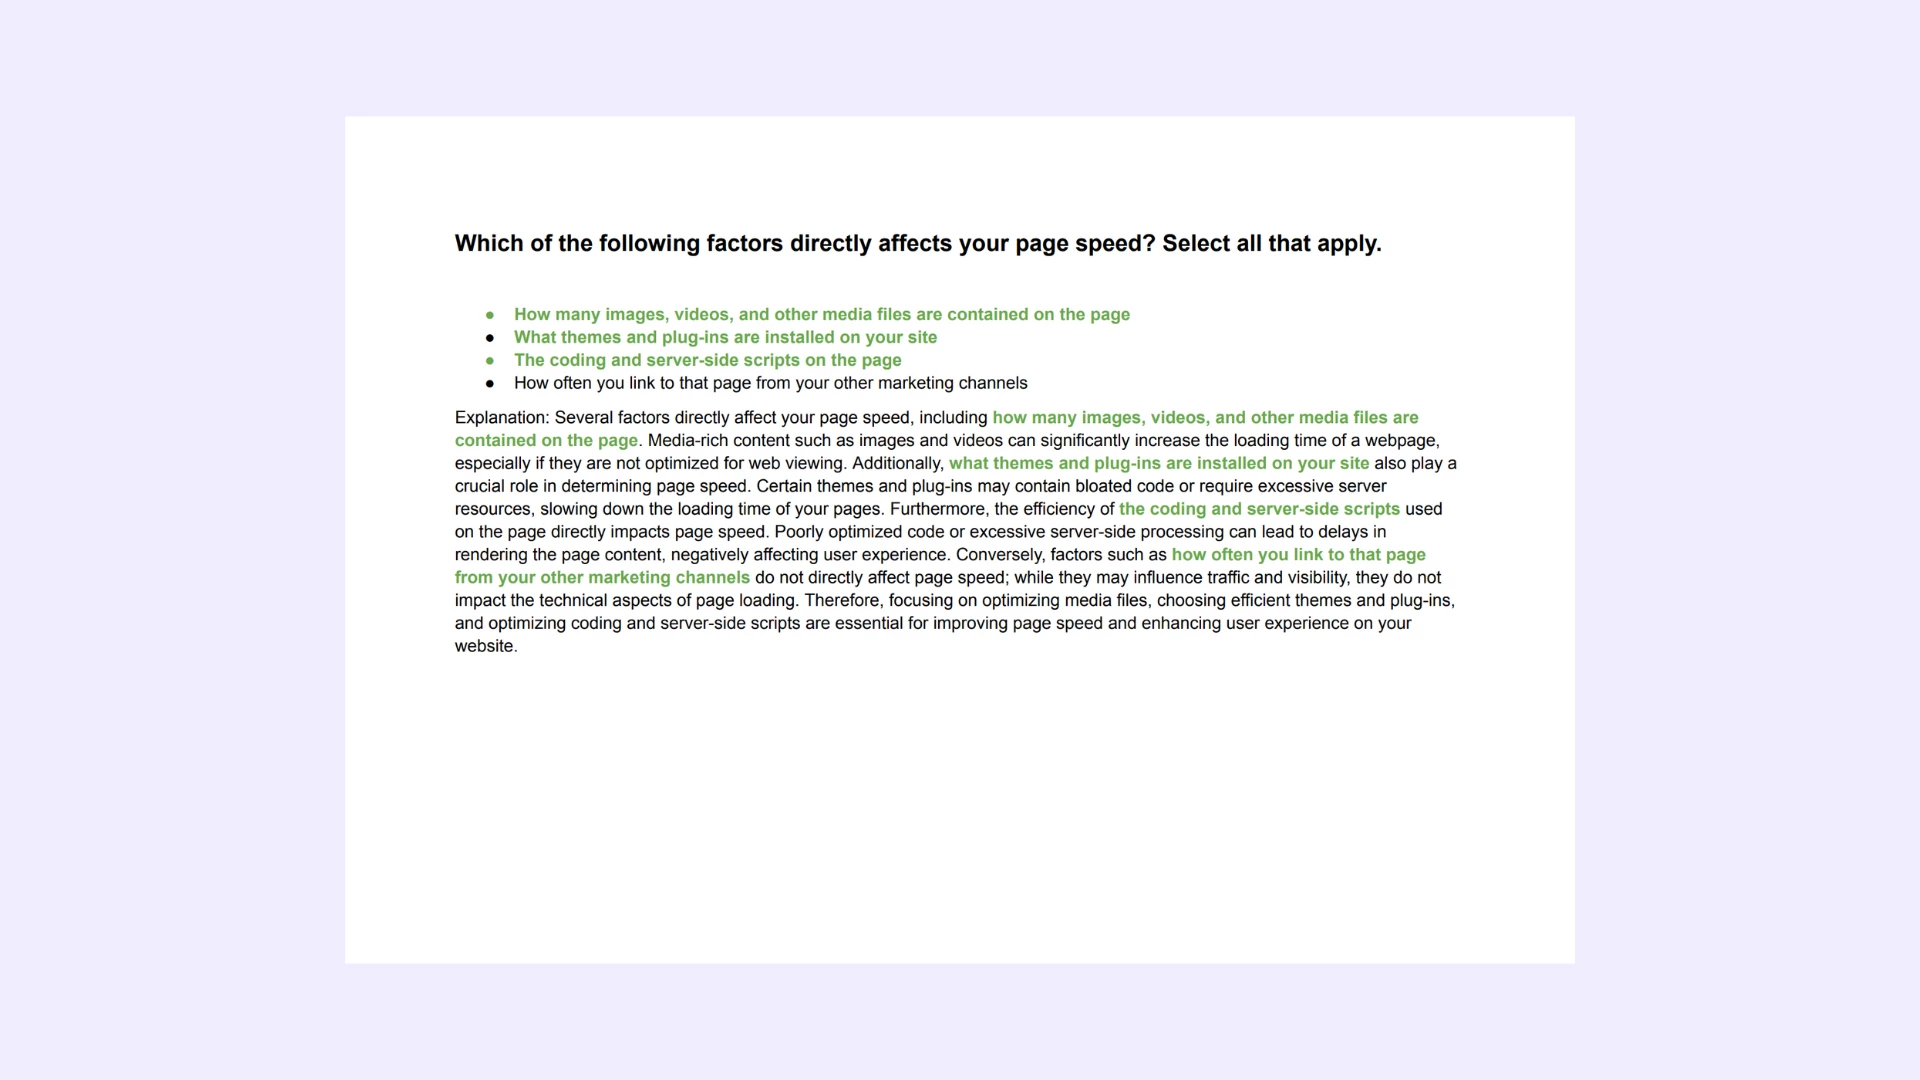
You’re building a report that can tell you which website pages your recent live chats are coming from. Based on the dimensions and measures you’d need to answer this question, which visualization type would be best suited for this report?
Table
Bar Chart
Pie Chart
Combination Table
HubSpot Roll. Includes Answers for Every Real HubSpot Certification Exam.
All-in-One: Get all HubSpot exams answers with explanations in one bundle. This package includes answers for every current HubSpot certification. Regular updates to reflect the latest exam version. -> See what's included.
Need a single cerification exam answers? Check out our -> list of certification exams answer keys. Learn Smarter. Obtain or Renew your certificates with peace of mind!
Explanation: You’re building a report that can tell you which website pages your recent live chats are coming from. Based on the dimensions and measures you’d need to answer this question, which visualization type would be best suited for this report?
Explanation: For a report aiming to discern the origin of recent live chats in terms of website pages, the most suitable visualization type would be a **Bar Chart**, as indicated by **option B**. A bar chart effectively presents categorical data (in this case, website pages) against a quantitative measure (such as the number of live chats), making it ideal for comparing the frequency or volume of live chats originating from different pages. Each bar represents a website page, and its length corresponds to the number of live chats associated with that page, providing a clear visual comparison. This visualization type allows for easy identification of trends, outliers, and patterns across website pages, enabling stakeholders to make informed decisions based on the distribution of live chat interactions. Compared to options like a table or pie chart, a bar chart offers a more intuitive and visually impactful way to analyze and interpret the relationship between website pages and live chat activity, making it the optimal choice for this specific reporting scenario.
Special Bundle Offer HubSpot Roll. All in One
Note: We conduct daily checks for updates on the exam, ensuring that the file contains the most recent questions from the actual certification program.
Questions | Answers | Explanations. FREE Updates.
You may also be interested:
- Special HubSpot bundle offer - all HubSpot exams in one
- HubSpot CMS for develpers certification exam answers
- HubSpot CMS for develpers II certification exam answers
- HubSpot content hub for marketers certification exam answers
- HubSpot content marketing certification exam answers
- HubSpot contextual marketing certification exam answers
- HubSpot digital advertising certification exam answers
- HubSpot digital marketing certification exam answers
- HubSpot email marketing certification exam answers
- HubSpot frictionless sales certification exam answers
- HubSpot growth driven design certification exam answers
- HubSpot inbound certification exam answers
- HubSpot inbound marketing certification exam answers
- HubSpot inbound marketing optimization certification exam answers
- HubSpot inbound sales certification exam answers
- HubSpot integrating with HubSpot I foundations certification exam answers
- HubSpot marketing hub software certification exam answers
- HubSpot reporting certification exam answers
- HubSpot revenue operations certification exam answers
- HubSpot sales enablement certification exam answers
- HubSpot sales hub software certification exam answers
- HubSpot sales management certification exam answers
- HubSpot sales software certification exam answers
- HubSpot seo certification exam answers
- HubSpot seo II certification exam answers
- HubSpot service hub software certification exam answers
- HubSpot social media marketing certification exam answers
- HubSpot social media marketing II certification exam answers